
LiDAR
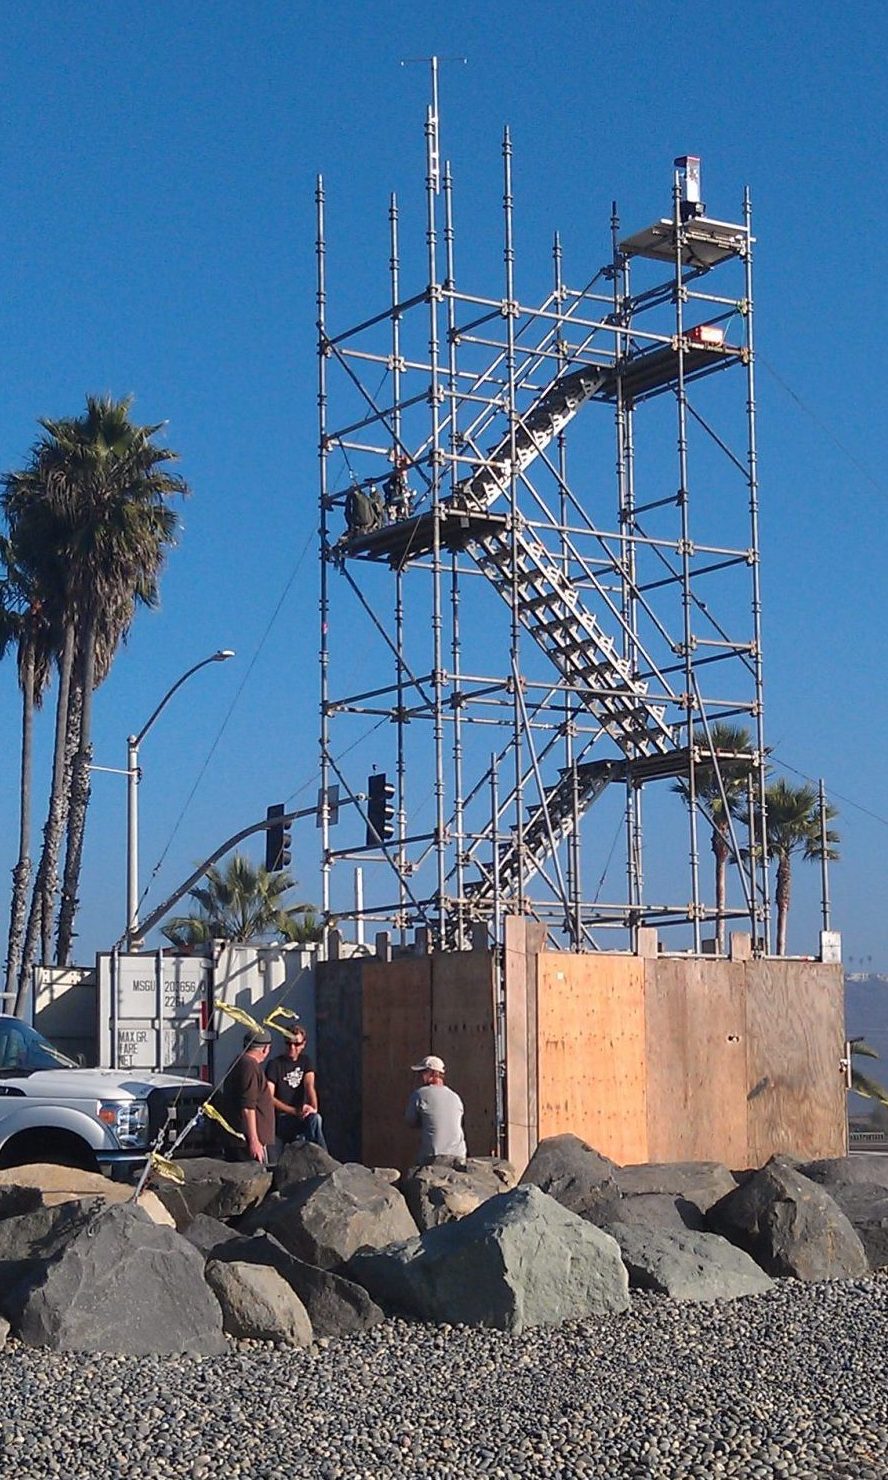
The Coastal Processes Group uses LiDAR scanners mounted on trucks, drones, all-terrain-vehicles, buildings, and towers to measure waves, and beach and cliff erosion. LiDAR (Light Detection and Ranging) measures the travel time for a laser photon (traveling at the speed of light) to reflect from a target and return to the source. A concept similar to sonar and radar, but with light instead of sound and radio waves. LiDAR is widely used in construction, agriculture, resource management, and transportation. LiDAR technology is evolving rapidly, with simple versions available on iPhones. We are evaluating LiDARs manufactured by Riegl, Velodyne and Ouster.
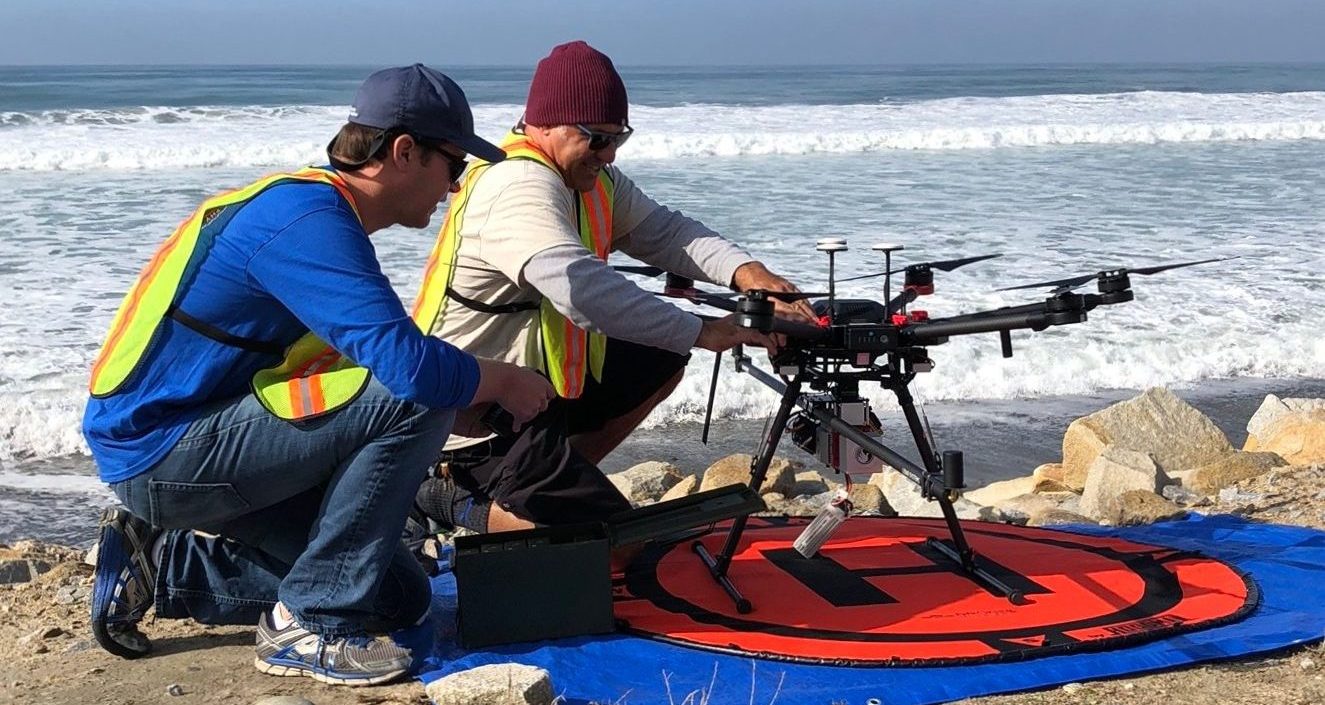
Drone mounted mobile LiDAR
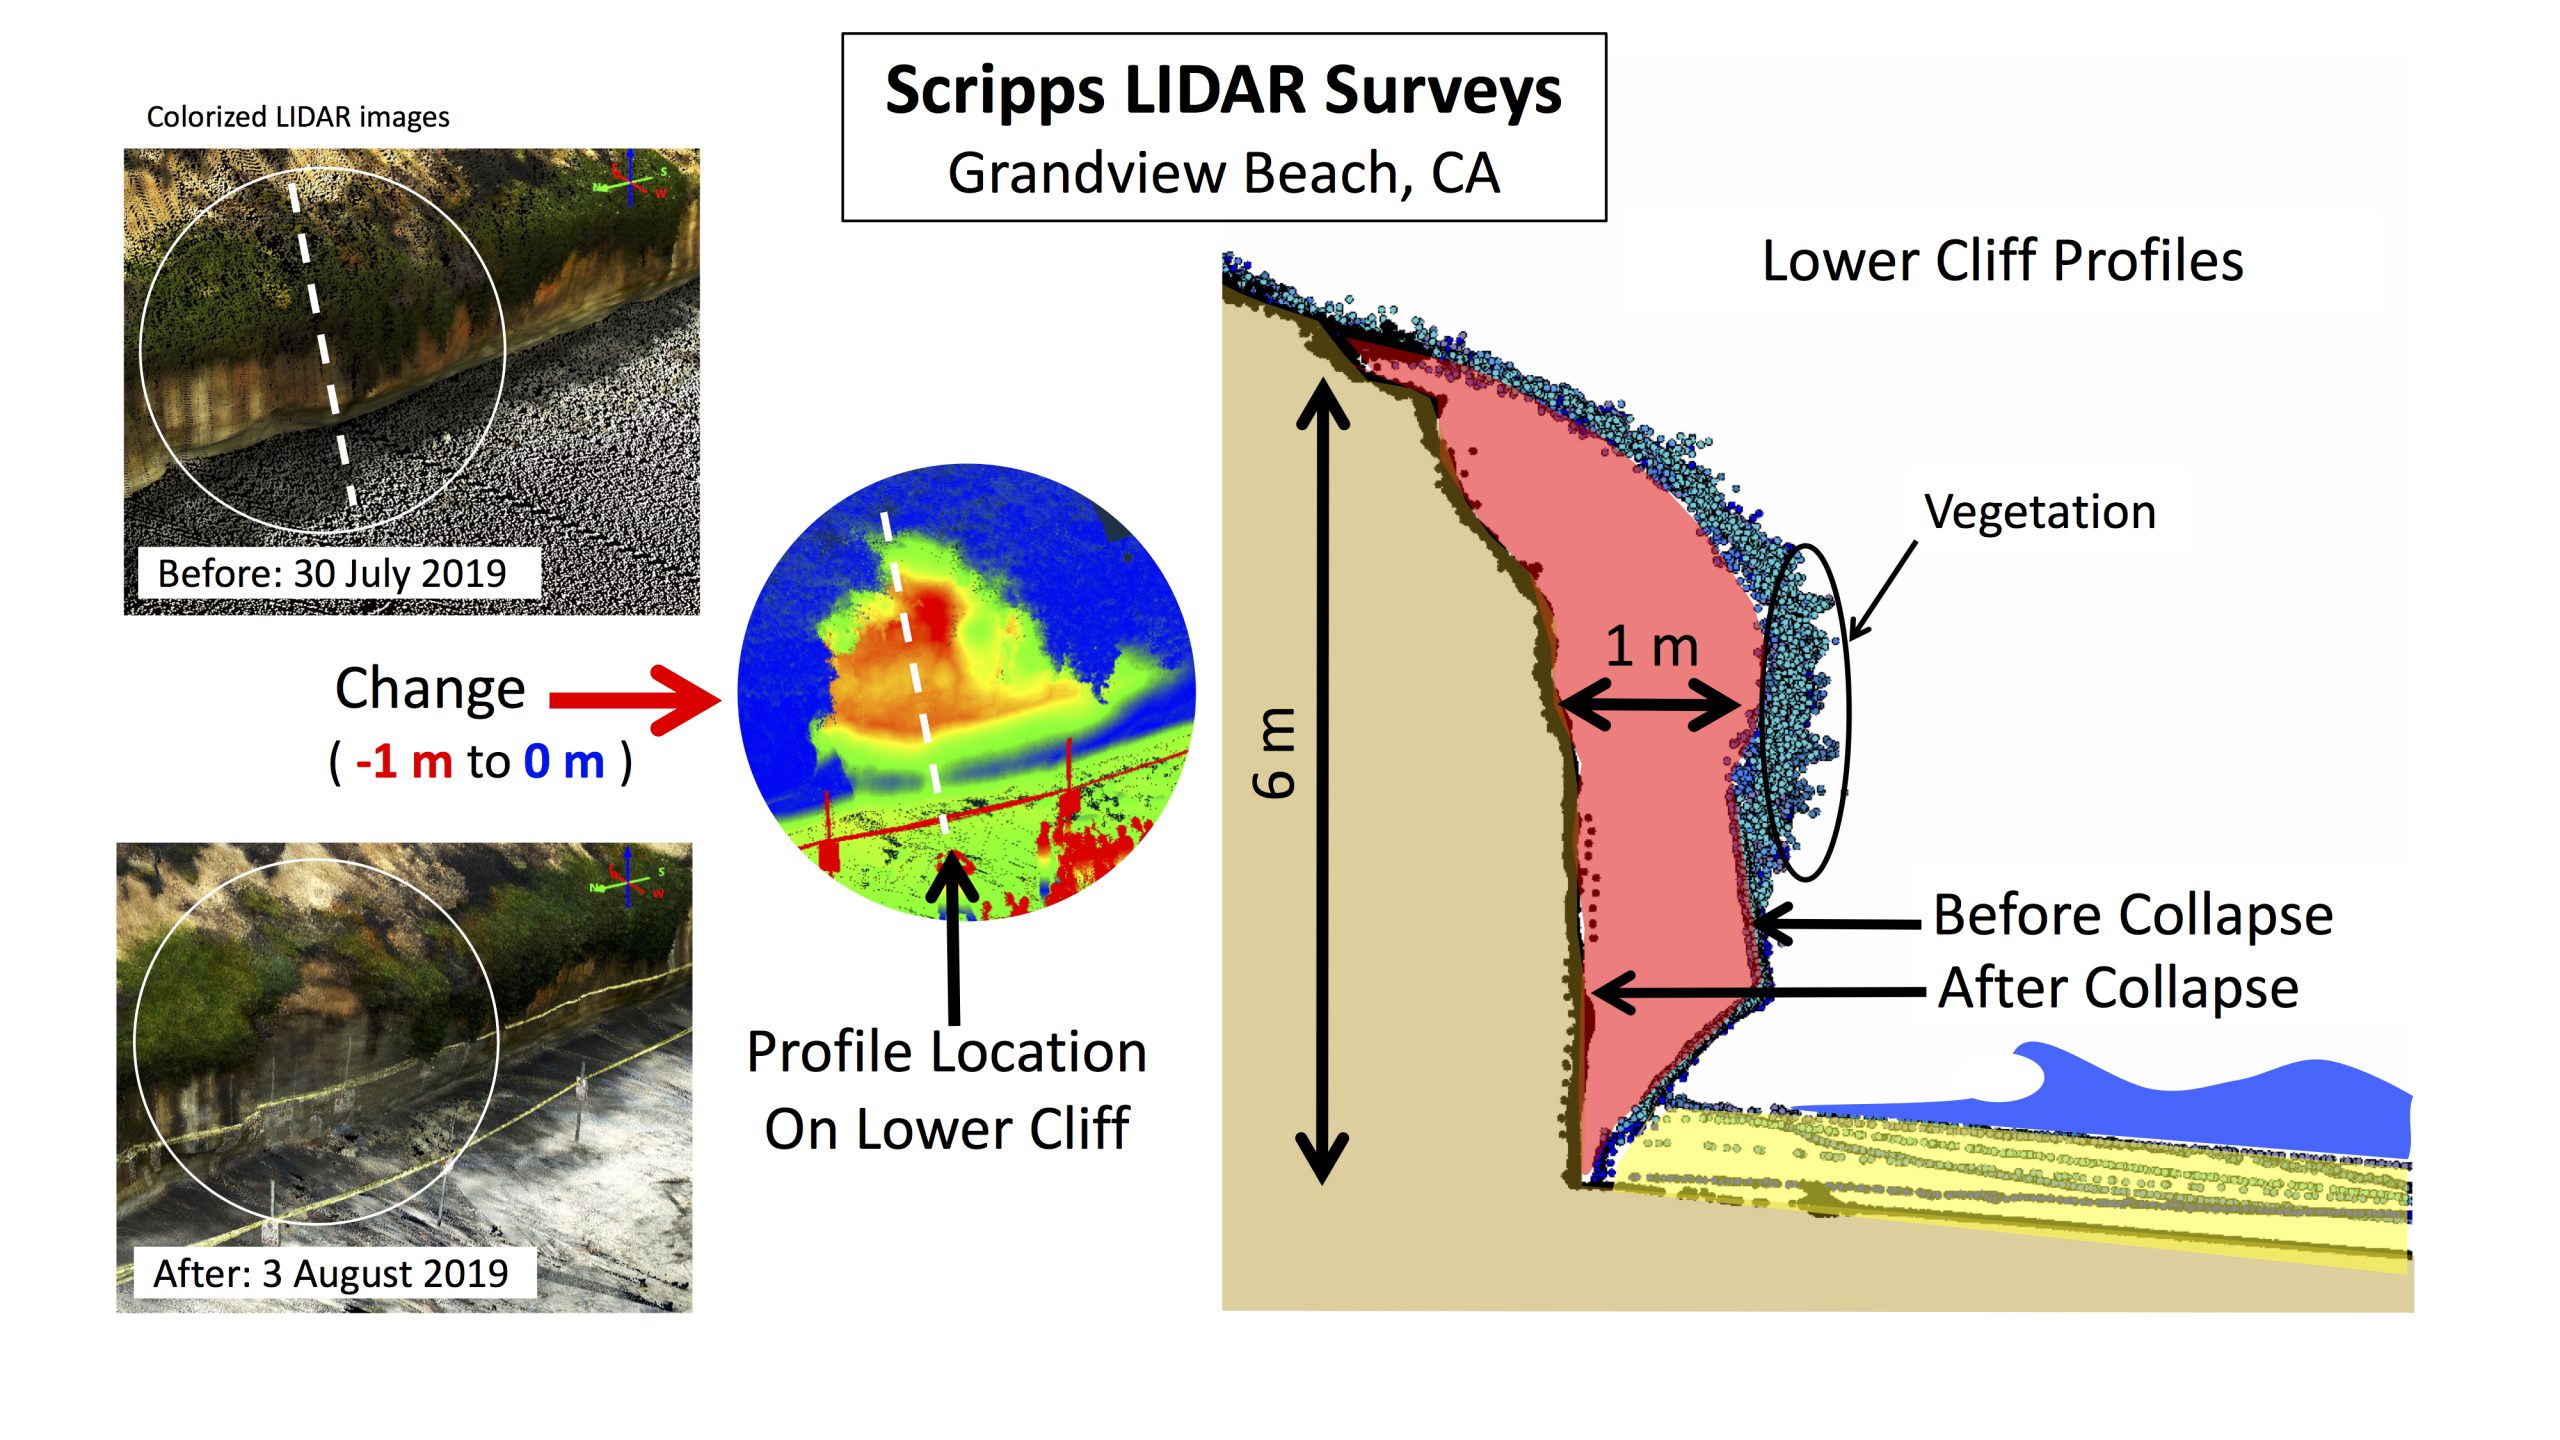
We mount a lightweight, short-range (~100m) LiDAR on a drone, and a heavier, more accurate, longer-range (~500m) LiDAR or a truck or fixed tower. Both LiDARs have small (few cm) errors. Mobile LiDARs are integrated with special GPS and IMU hardware. In a few hours the truck-mounted LiDAR scans ~10 km of beach and cliff with high spatial resolution (~1000 pts/m2). Drones provide surveys of otherwise inaccessible cliff tops. LiDAR is also used to measure wave runup.
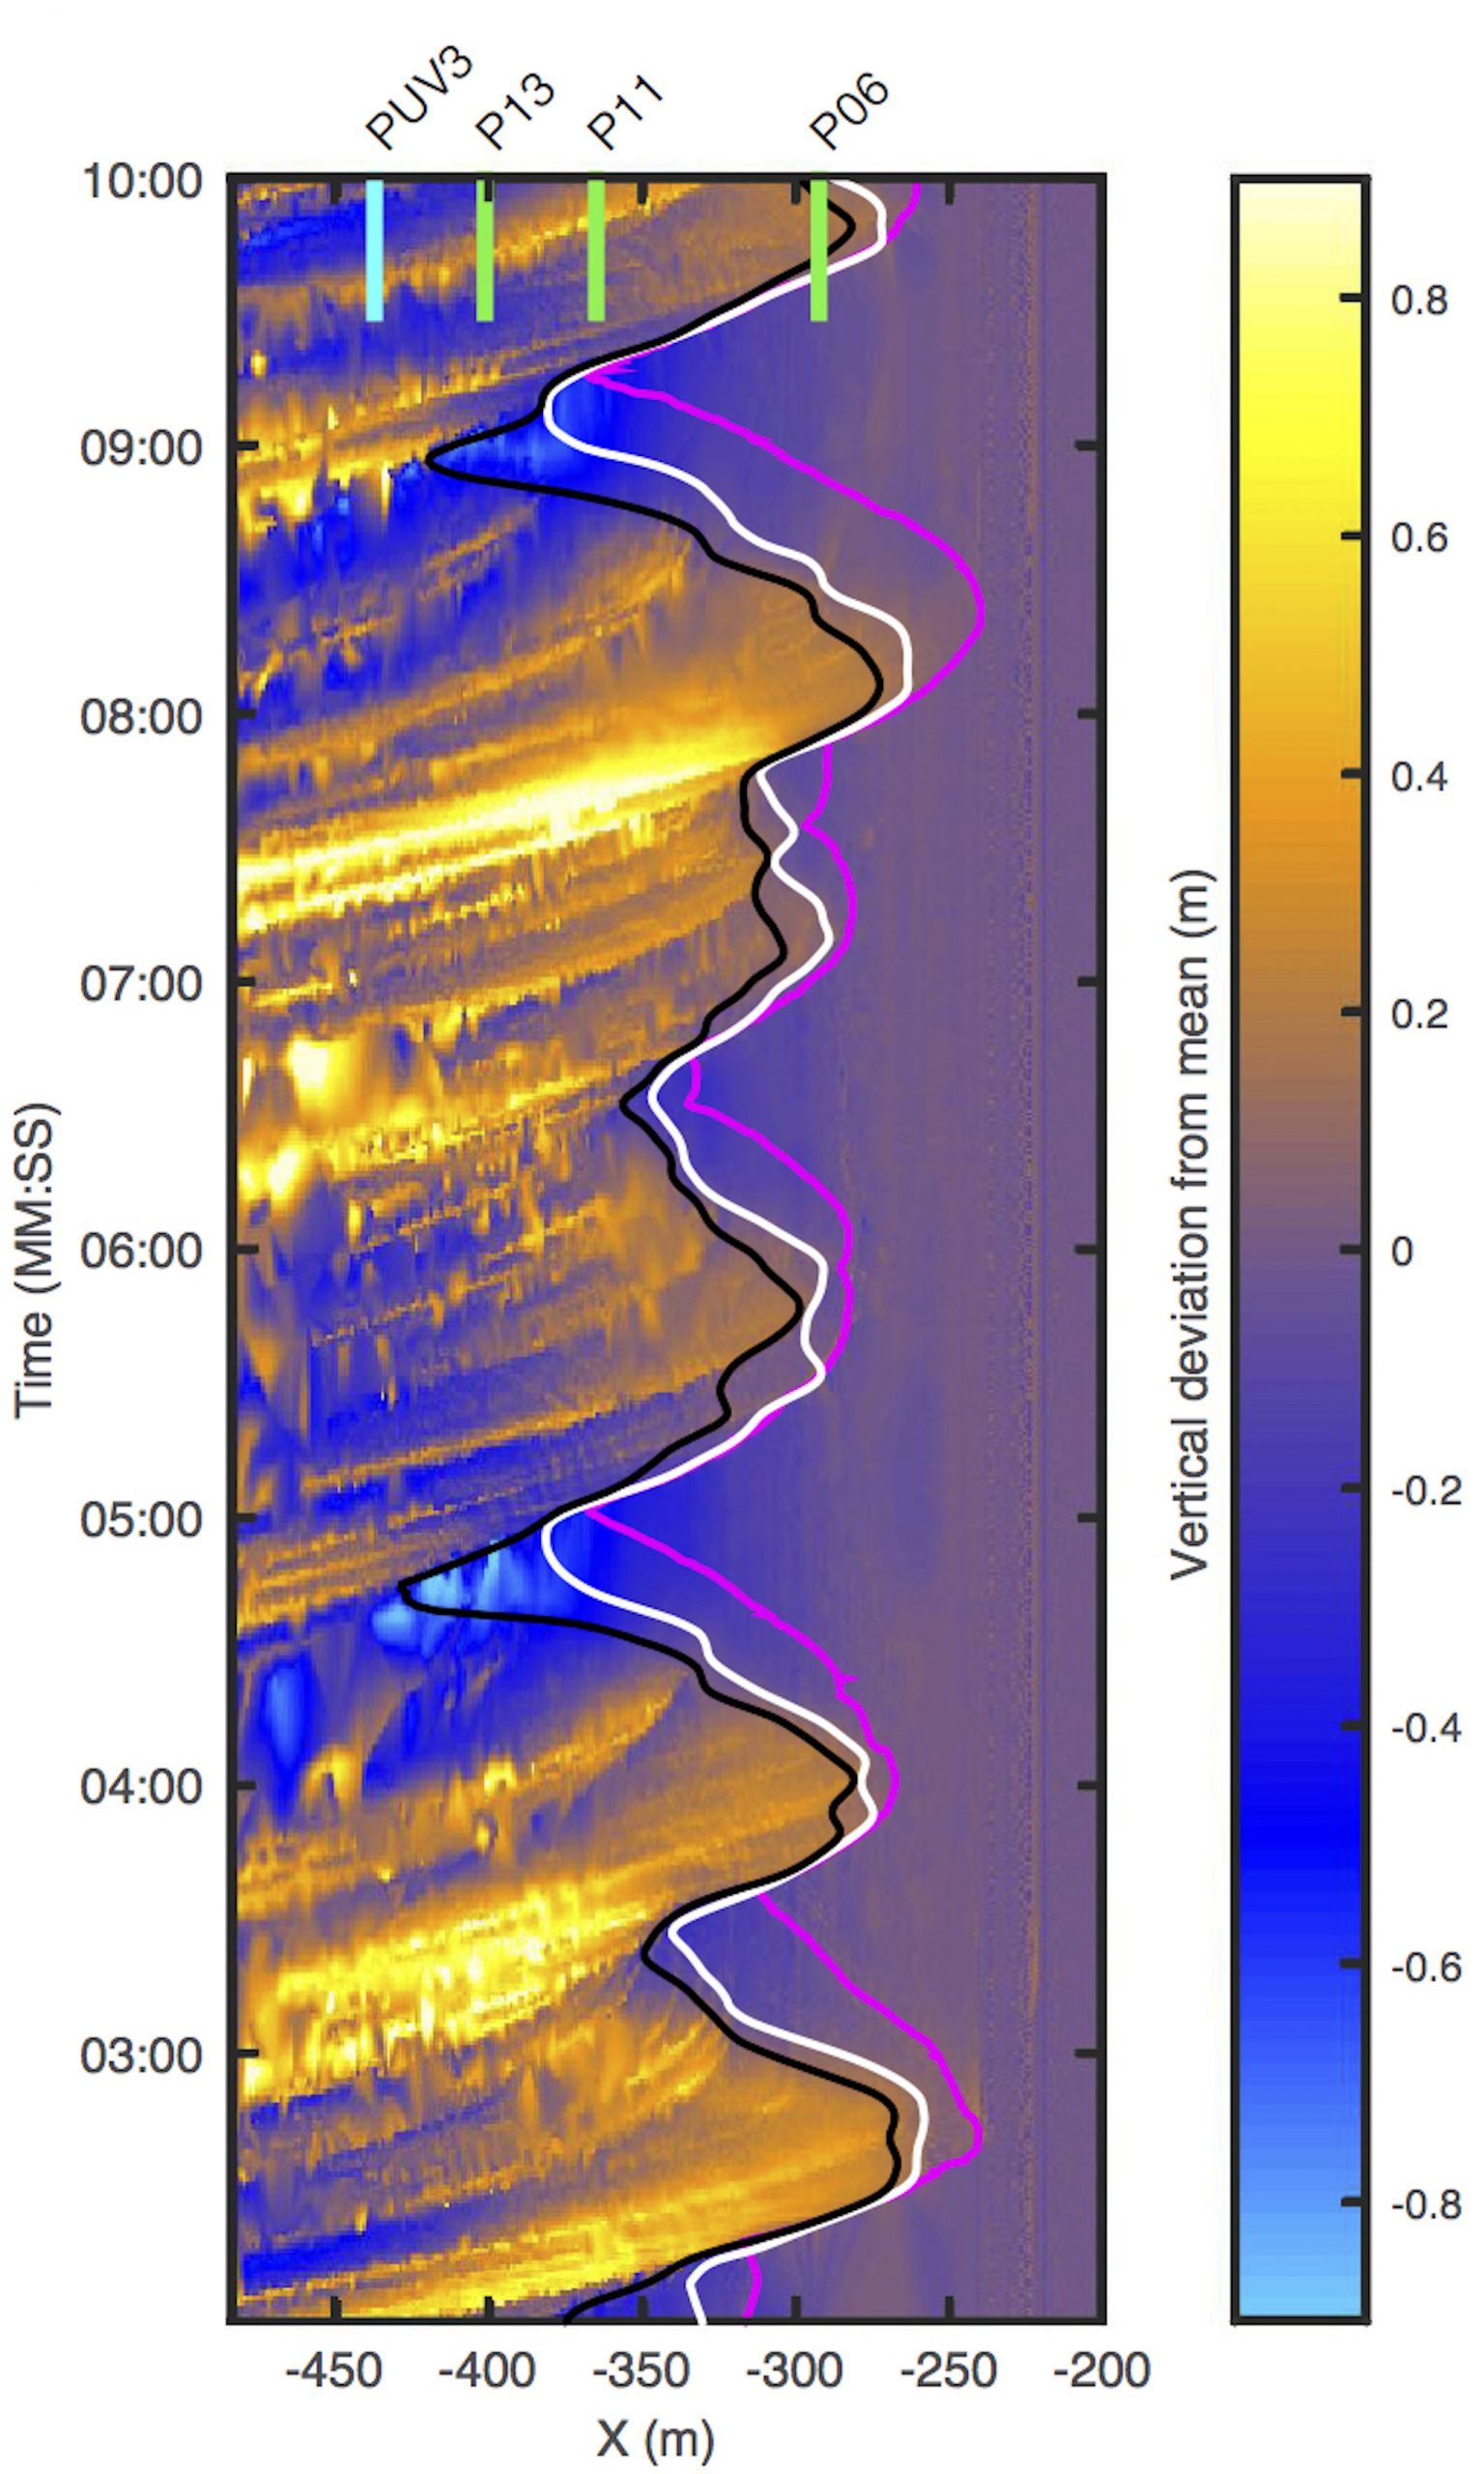
Agate Beach: Offshore waves were pumping (T=15 sec, H = 7.5m). The curves are 3 estimates of the waterline using different definitions of “waterline” (pink is visual from a camera, and black and white are from a LiDAR). The estimates all show large runup cross-shore excursions (more than 100m peak-to-peak) at long ~1min periods (~7 runup waves in 8 min). LiDAR measures waves as they cross the surfzone (orange shows wave crests, and blue wave troughs). These long period (called “surf beat” or “infragravity) waves have long been studied by Scripps researchers, first in 1950 by the legendary Walter Munk.