Beach Change
Sandy beaches are a precious natural resource, valuable from economic, recreational, and cultural-spiritual perspectives. Sandy beaches evolve naturally, widening or retreating as sea level and inland erosion vary over decades and centuries. Coastal cliffs can retreat slowly, or in bursts driven by exceptionally heavy rain and waves. The natural patterns of beach evolution have been significantly and permanently altered in California (and elsewhere) by sea walls, jetties, harbors, lagoon management, and inland flood control and land use. The amount of sediment delivered annually to southern California beaches from cliffs and rivers has decreased over time, and the alongshore distribution interrupted. Beaches cannot readily retreat landward owing to houses, highways, railroads, hotels, and parks. Beach ecosystems are threatened.

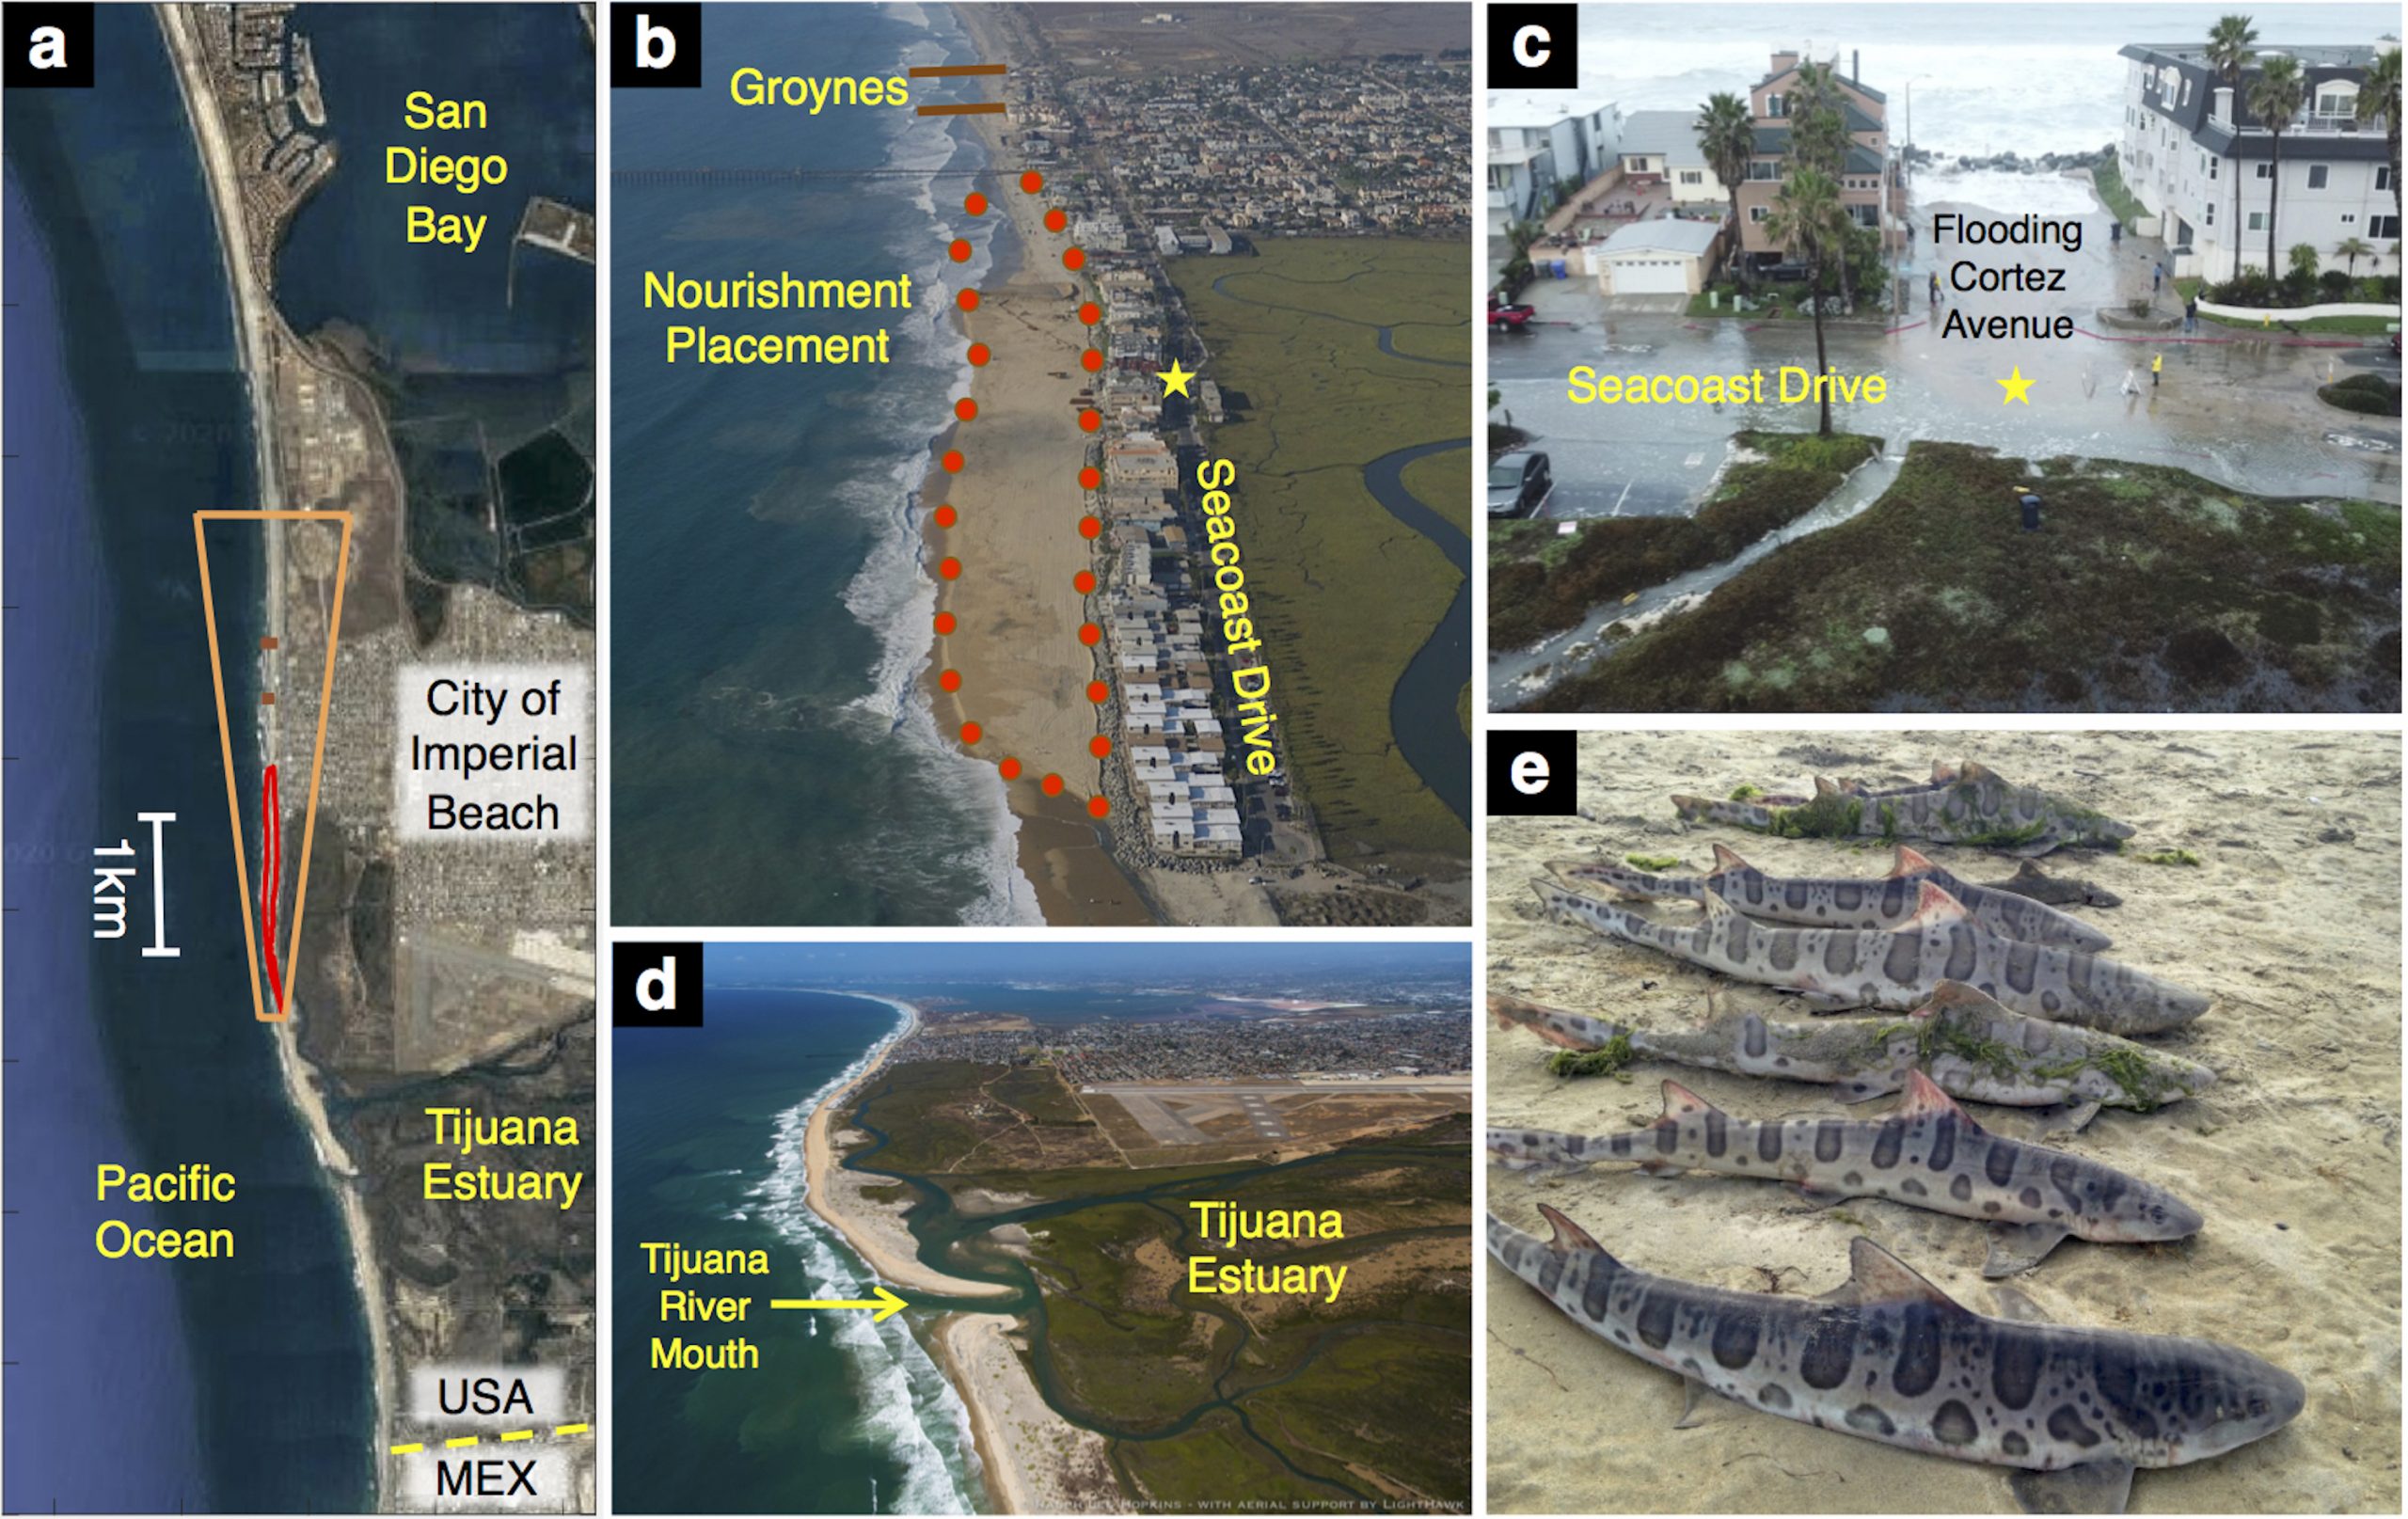
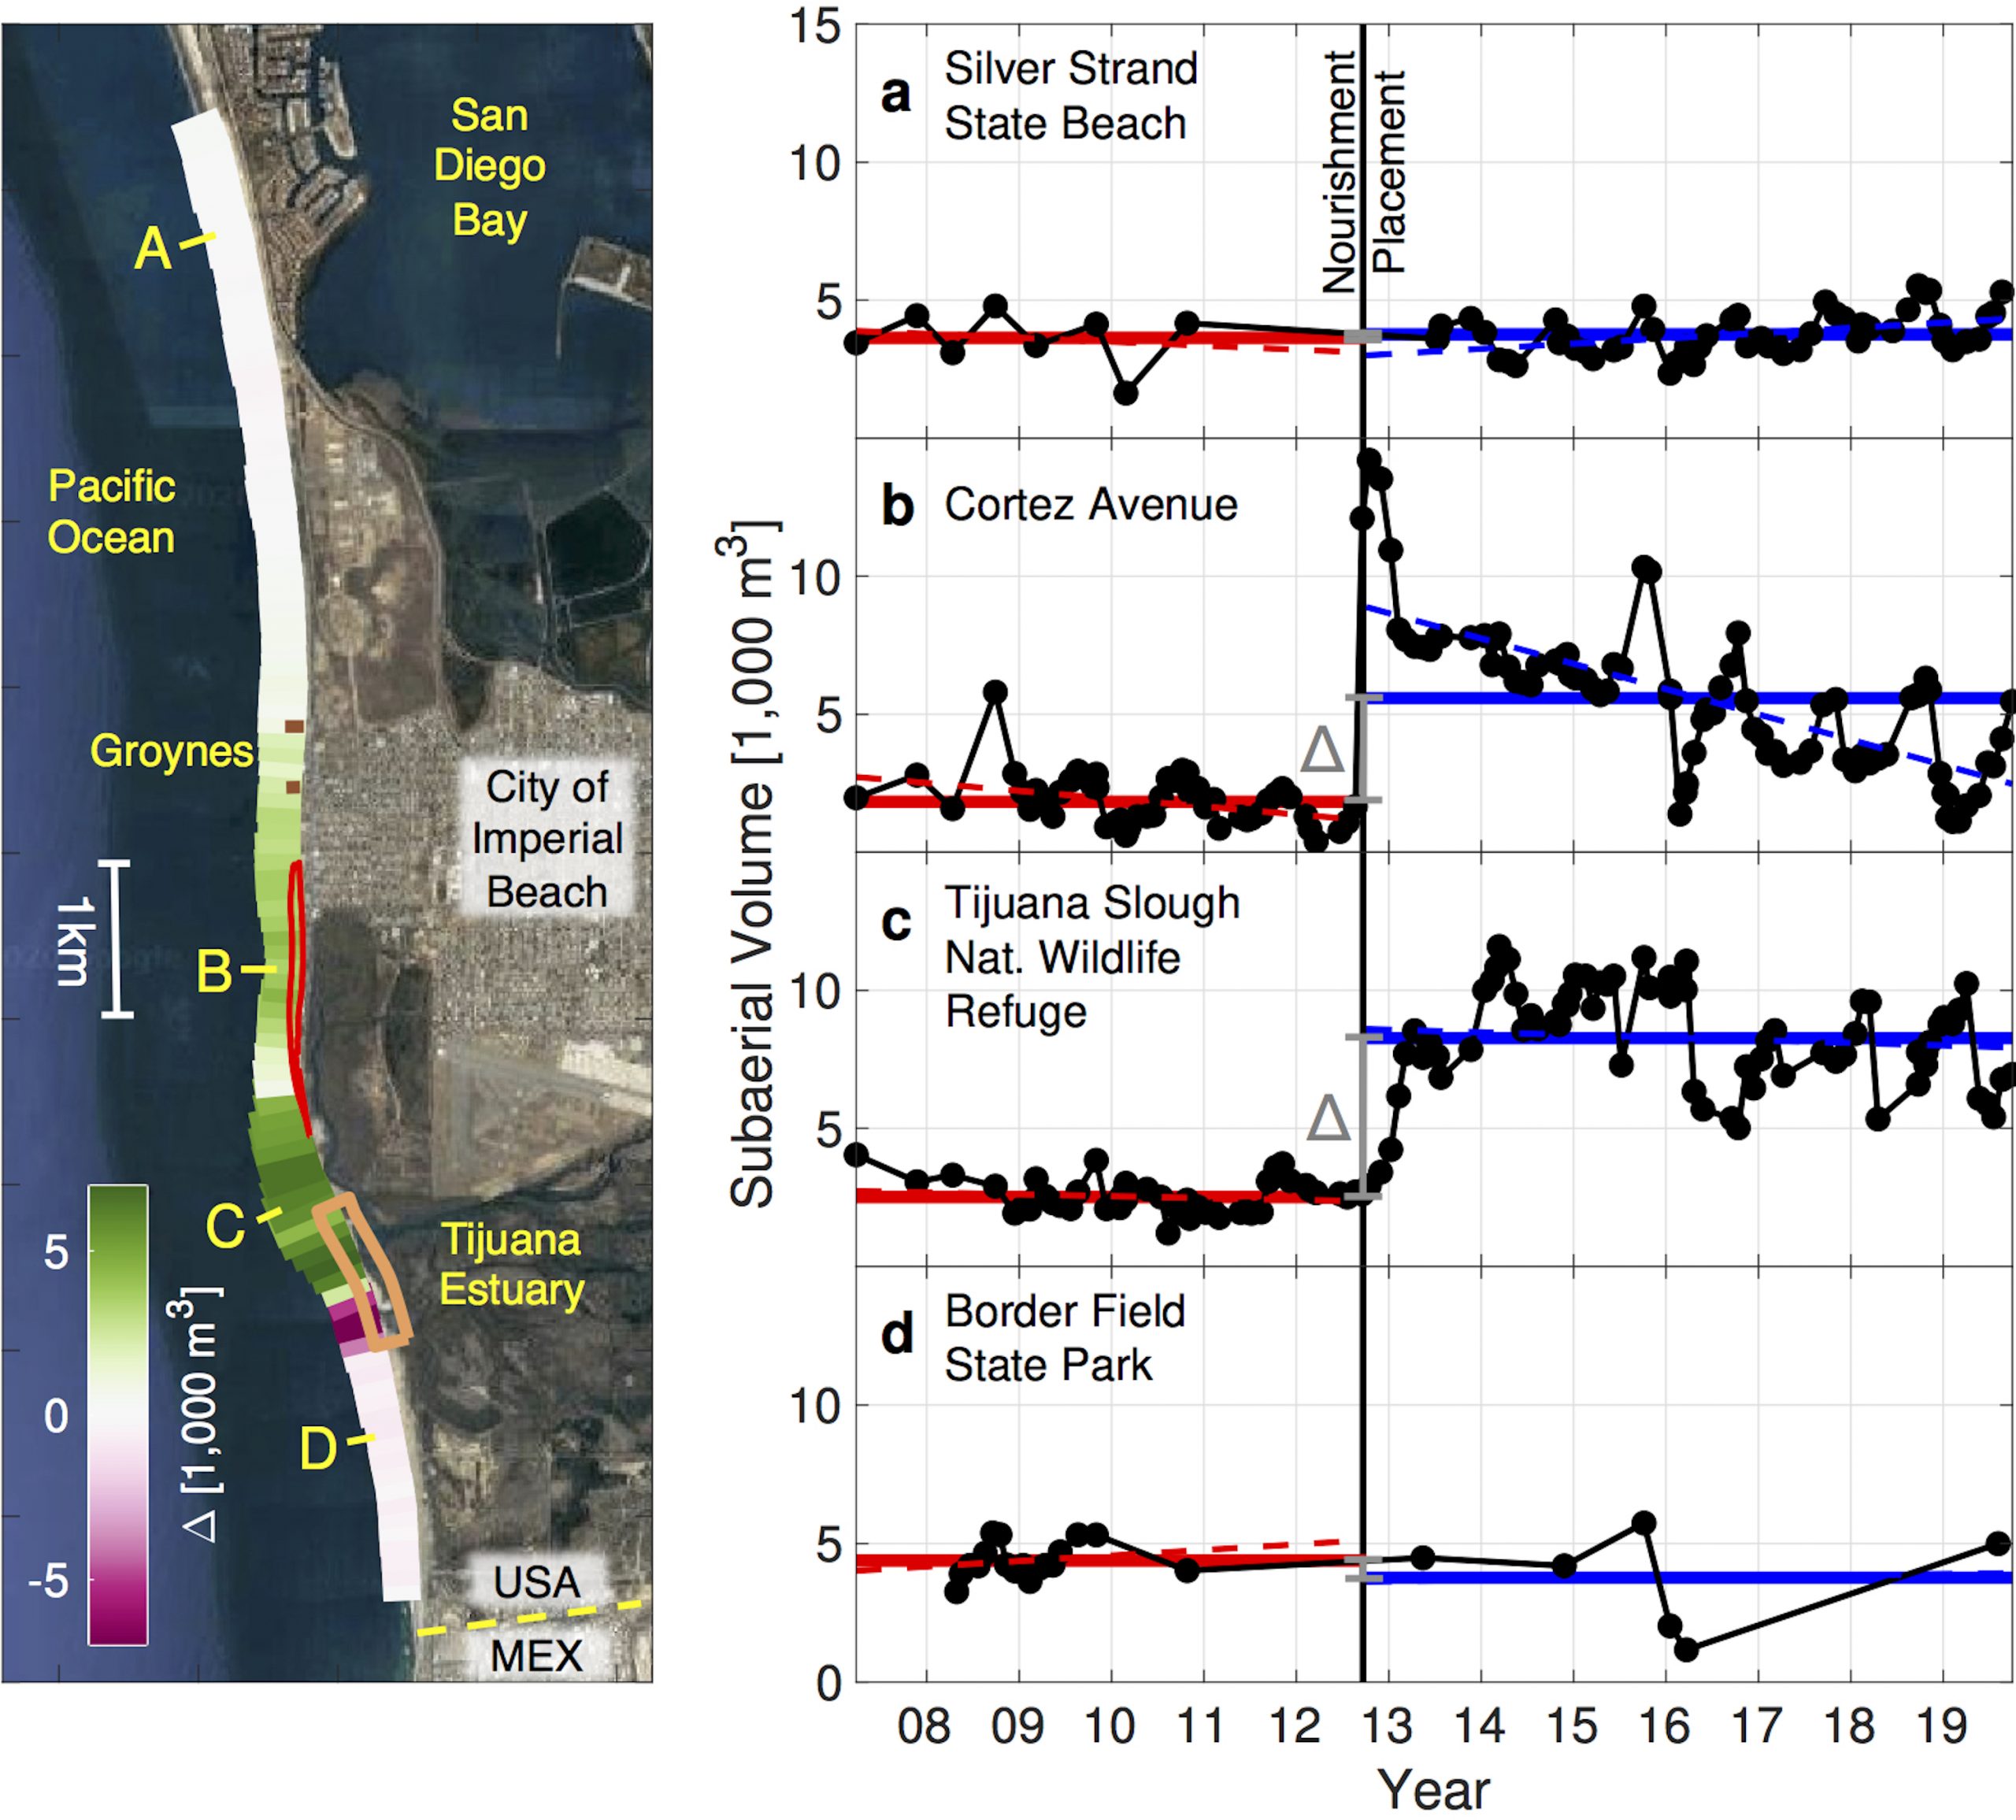
We observe waves and beach sand levels in a range of settings, including beaches nourished with imported sand with costs totaling in the 10s of millions of dollars. Data collection methods are described in technology. The videos give background. The San Diego Beach Report contains distilled results for 9 state beach parks in San Diego county. In 2012, Imperial Beach was widened with imported sand (Figure 1). That sand is still widening beaches to the south of the original nourishment (Figure 2c).


Figure 2: (left) Change in sand volume before (6 year average) and after (6year average) the 2012 nourishment. Sand volumes are elevated (green) between groynes (stub jetties) and the mouth of the Tijuana estuary, suggesting this region is influenced by the nourishment. The area of migrating spits near the river mouth is outlined in orange. (a-d) Subaerial sand volumes versus time for 100m long sections A-D, respectively. Time-mean volumes before-after are red-blue solid lines. Since nourishment, the Cortez Avenue Beach (b) has been eroding.
Publications
de Schipper, M. A., B. C. Ludka, T. A. Schlacher, B. Raubenheimer, A. P. Luijendijk, Beach nourishment has complex implications for the future of sandy shores. accepted to Nature Reviews Earth & Environment (2020).
Cagigal, L., A. Rueda, D. Anderson, P. Ruggiero, M. A. Merrifield, J. Montano, G. Coco, and F. J. Mendez (2020), A multivariate, stochastic, climate-based wave emulator for shoreline change modelling, Ocean Modelling, 154, 101695
Kalligeris, N., P.B. Smit, B.C. Ludka, R.T. Guza, T.W. Gallien (2020), Calibration and assessment of process-based numerical models to predict beach profile evolution in southern California, Coastal Engineering, Volume 158, 2020, 103650, ISSN 0378-3839, https://doi.org/10.1016/j.coastaleng.2020.103650.
Montaño, J., G. Coco, J. Antolinez, T. Beuzen, K. Bryan, L. Cagigal, B. Castelle, M. Davidson, E. Goldstein, R. Ibaceta, D. Idier, B. Ludka, S. Masoud-Ansari, F. Mendez, A. Murray, N. Plant, K. Ratliff, A. Robinet, A. Rueda, N. Senechal, J. Simmons, K. Splinter, S. Stephens, I. Townend, S. Vitousek, and K. Vos, Blind testing of shoreline evolution models. Scientific Reports (2020), in press.
Ludka, B. C., R. T. Guza, W. C. O’Reilly, M. A. Merrifield, R. E. Flick, S. Bak, T. Hesser, R. Bucciarelli, C. Olfe, B. Woodward, W. Boyd, K. Smith, M. Okihiro, R. Grenzeback, L. Parry, and G. Boyd (2019), Sixteen years of bathymetry and waves at San Diego Beaches, Scientific Data, 6:161, https://doi.org/10.1038/s41597-019-0167-6.
Young, A.P., R.E. Flick, T.W. Gallien, S.N. Giddings, R.T. Guza, M. Harvey, L. Lenain, B.C. Ludka, W.K. Melville, W.C. OReilly (2018), Southern California Coastal Response to the 2015-16 El Niño, Journal of Geophysical Research: Earth Surface, 123:3069-3083, 10.1029/2018JF004771.
Ludka, B. C, R.T. Guza, W.C. O'Reilly (2018), Nourishment evolution and impacts at four southern California beaches: A sand volume analysis, Coastal Engineering, Volume 136, Pages 96-105, ISSN 0378-3839, https://doi.org/10.1016/j.coastaleng.2018.02.003.
Barnard, P. L., Hoover, D., Hubbard, D. M., Snyder, A., Ludka, B. C., Kaminsky, G. M., Ruggiero, P., Gallien, T., Gabel, L., McCandless, D., Weiner, H. M., Cohn, N., Anderson, D. L., Serafin, K. A. (2017), Extreme oceanographic forcing and coastal response due to the 2015-2016 El Niño. Nature Communications, 8, 14365, doi:10.1038/ncomms14365.
Ludka, B.C., T. Gallien, S.C. Crosby, R.T. Guza (2016), Mid-El Niño erosion at nourished and unnourished southern California Beaches, Geophys. Res. Lett., 43(9), 4510-4516, doi: 10.1002/2016GL068612.
Ludka, B. C. (2016). Wave-driven beach sand level changes in southern California. UC San Diego. ProQuest ID: Ludka_ucsd_0033D_15849. Merritt ID: ark:/13030/m5518kt3. Retrieved from https://escholarship.org/uc/item/1zz000zk
Doria, A, R.T. Guza, W.C. O’Reilly, M.L. Yates (2016), Observations and modeling of San Diego beaches during El Niño, Continental Shelf Research, 124, 153-164, doi: 10.1016/j.csr.2016.05.008.
Ludka, B.C., R.T. Guza, W.C. O'Reilly, and M.L. Yates (2015), Field evidence of beach profile evolution toward equilibrium, J. Geophys. Res. Oceans, 120, 7574–7597, doi: 10.1002/2015JC010893.
