
High Resolution Estuary/Coastal Numerical Model Development at LPL
For more information on estuary research, check out the Giddings Lab website.
A 2019 augmentation award from the California Department of Parks and Recreation Natural Resources Division – Coastal Program, supported additional observational collection, as well as preliminary development of a realistic wave-current coupled hydrodynamic simulation for the Torrey Pines/Los Peñasquitos Lagoon region. The realistic numerical model includes tides, waves, river flow, and atmospheric forcing. The model grid has very high resolution (~7 m in the horizontal) near the mouth of Los Peñasquitos Lagoon stretching out to ~50 m near the northern model boundary and ~100 near the southern model boundary. Boundary conditions were extracted from the validated parent nest (see Figure 1a and b, LV3). 15 months of hindcast simulations on the highest resolution grid, including wave coupling, were completed from 6/1/2019 – 9/30/2020. Water level and wave validations compared well with the model. Additional model validation of currents and temperature show offsets relative to data which is inherited from our open boundary conditions. Figures below show the model setup, a snapshot from the model simulations, and a movie of the simulation output.
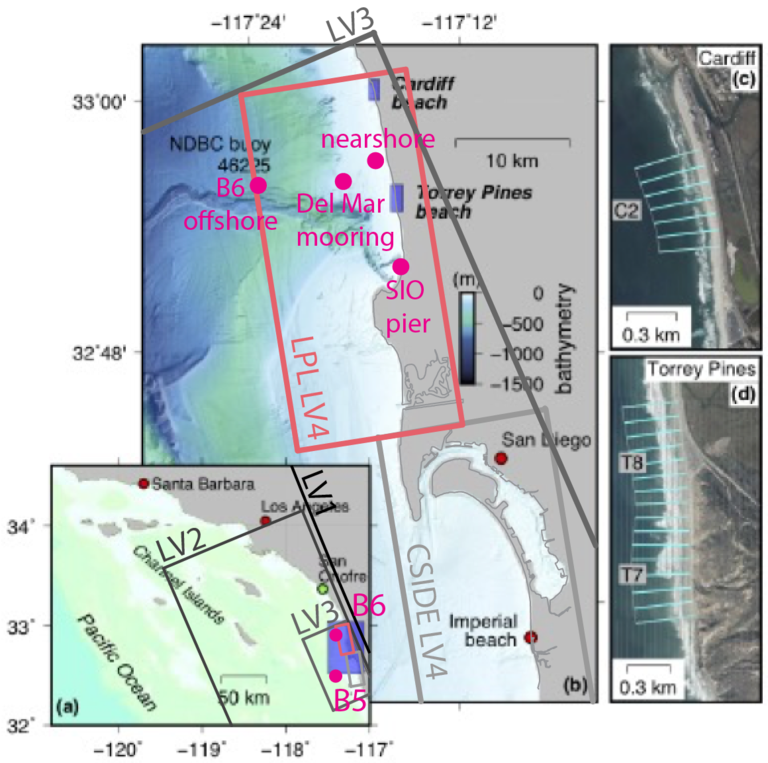
Figure 1. (a) regional map that shows parent model domains (LV1-LV3). (b) regional map with the domain of the high resolution model (LPL LV4) highlighted in red. Note buoy locations B6, nearshore, SIO pier, and the Del Mar mooring were used in model validation.
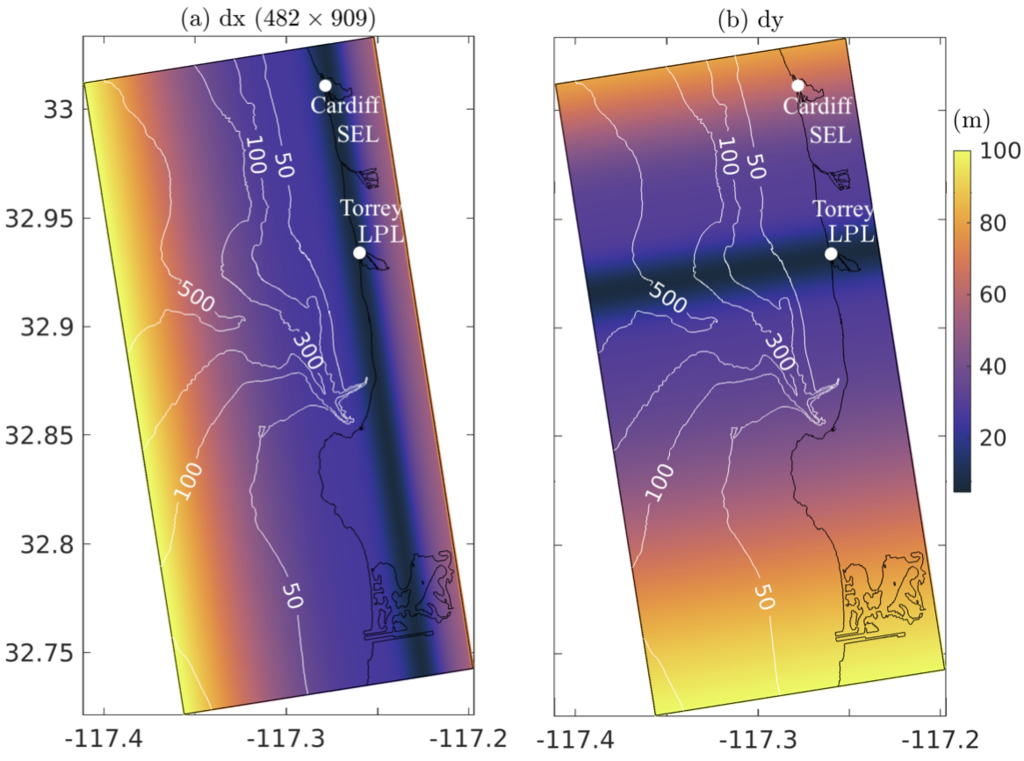
Figure 2. LPL LV4 resolution. Color shows the horizontal resolution of the highest resolution child grid, LV4 which focuses the highest resolution around Los Peñasquitos lagoon (LPL).
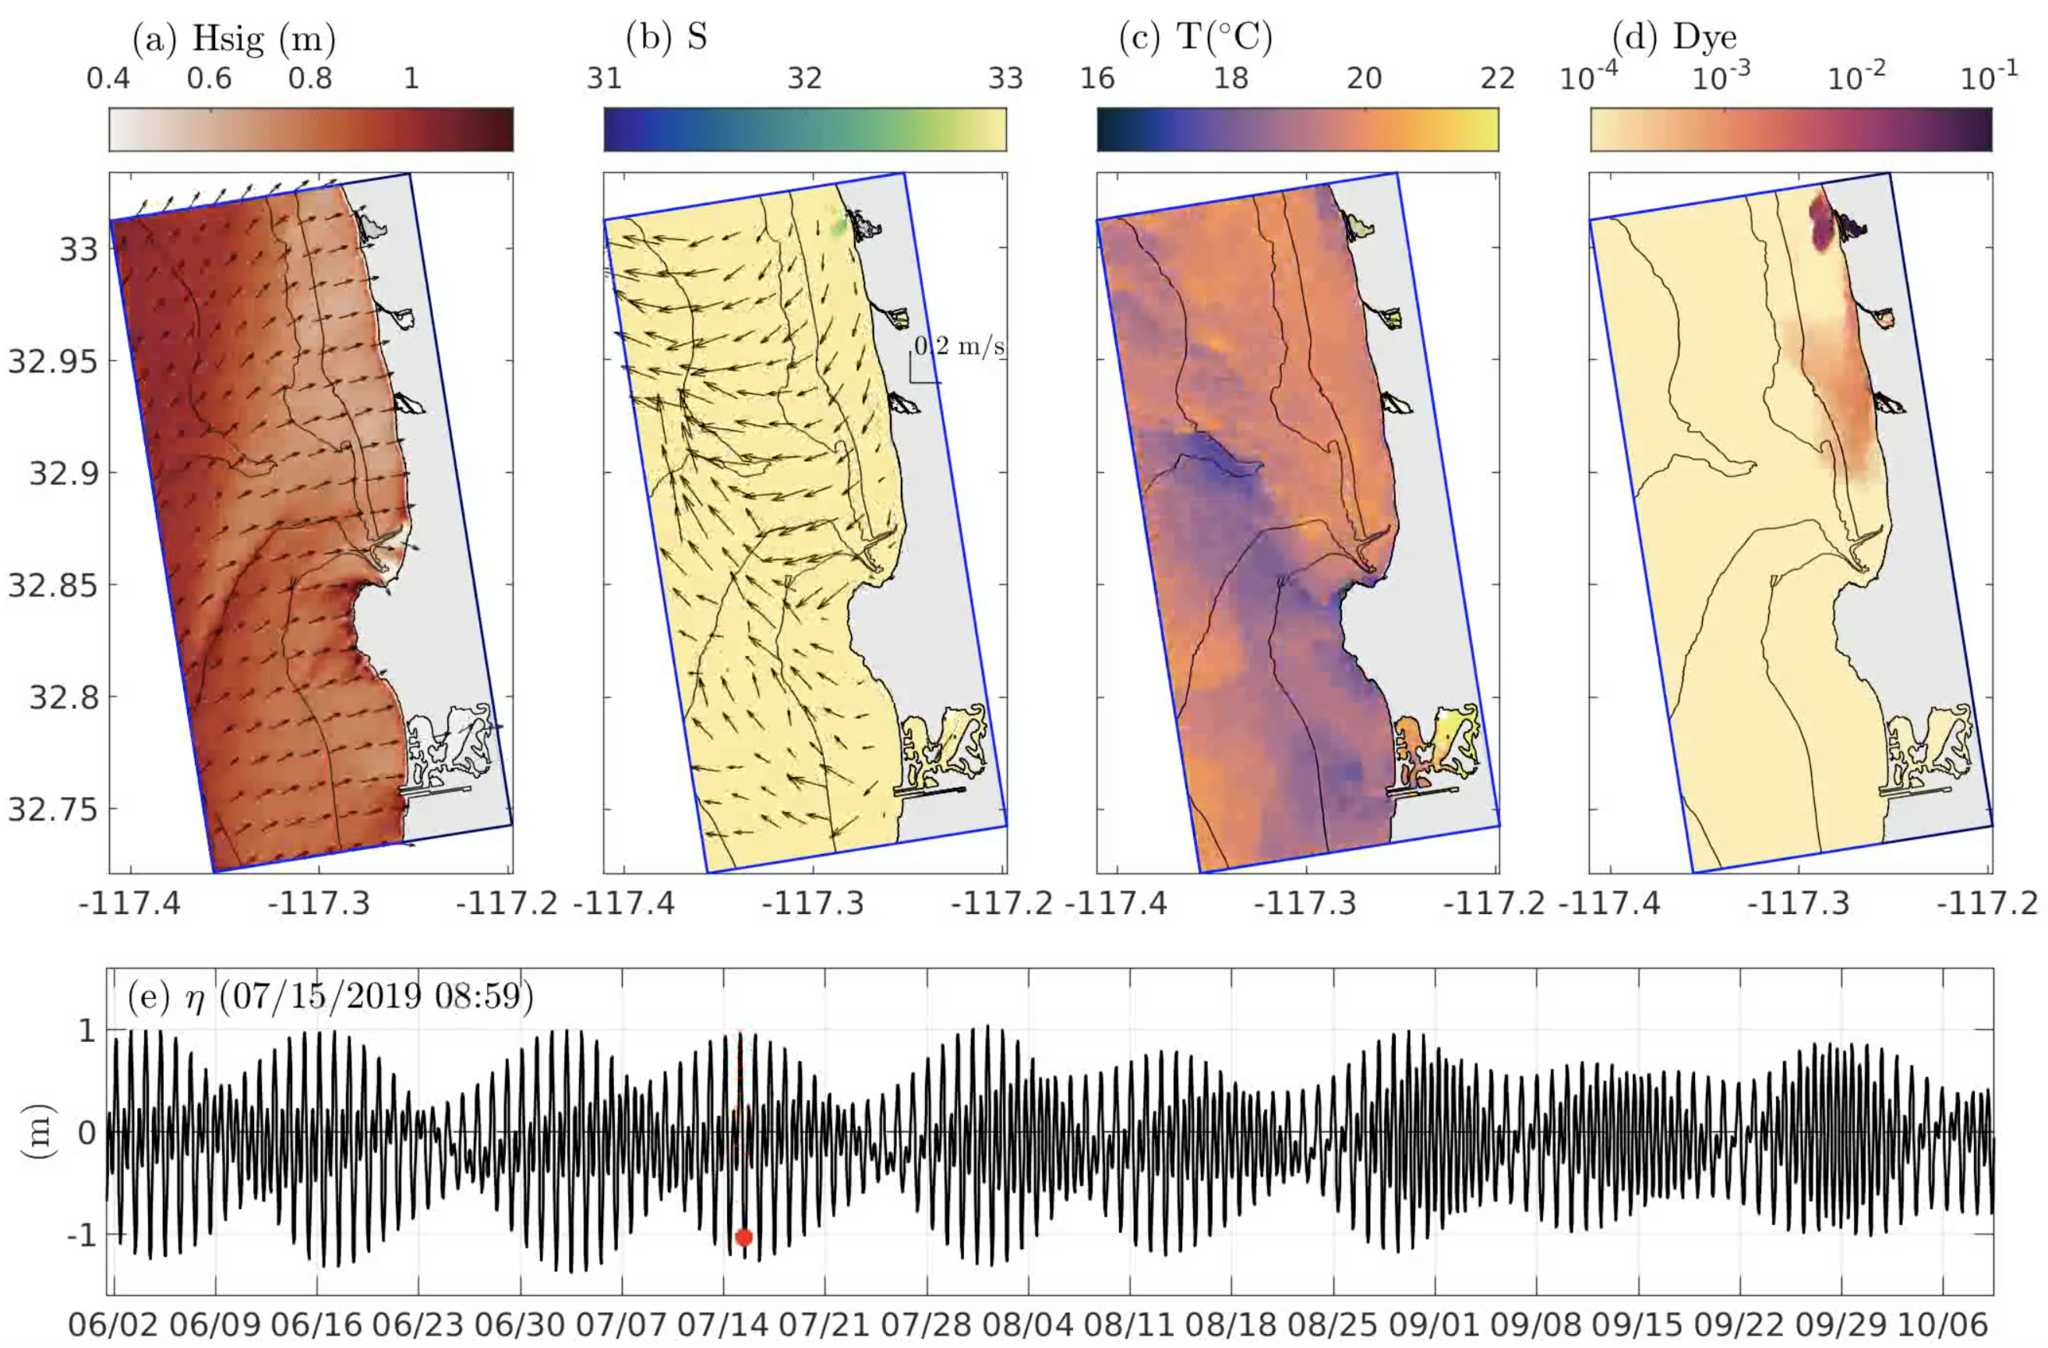
Figure 3. LV4 LPL model snapshot on 7/15/2019. a) significant wave height (color) and direction (arrows), b) surface salinity, c) surface temperature, d) surface dye concentration (dye is released with the freshwater sources in each estuary) over the full LV4 domain, and e) sea surface elevation over the first 4 months of the simulation with the snapshot time marked with a red dot.
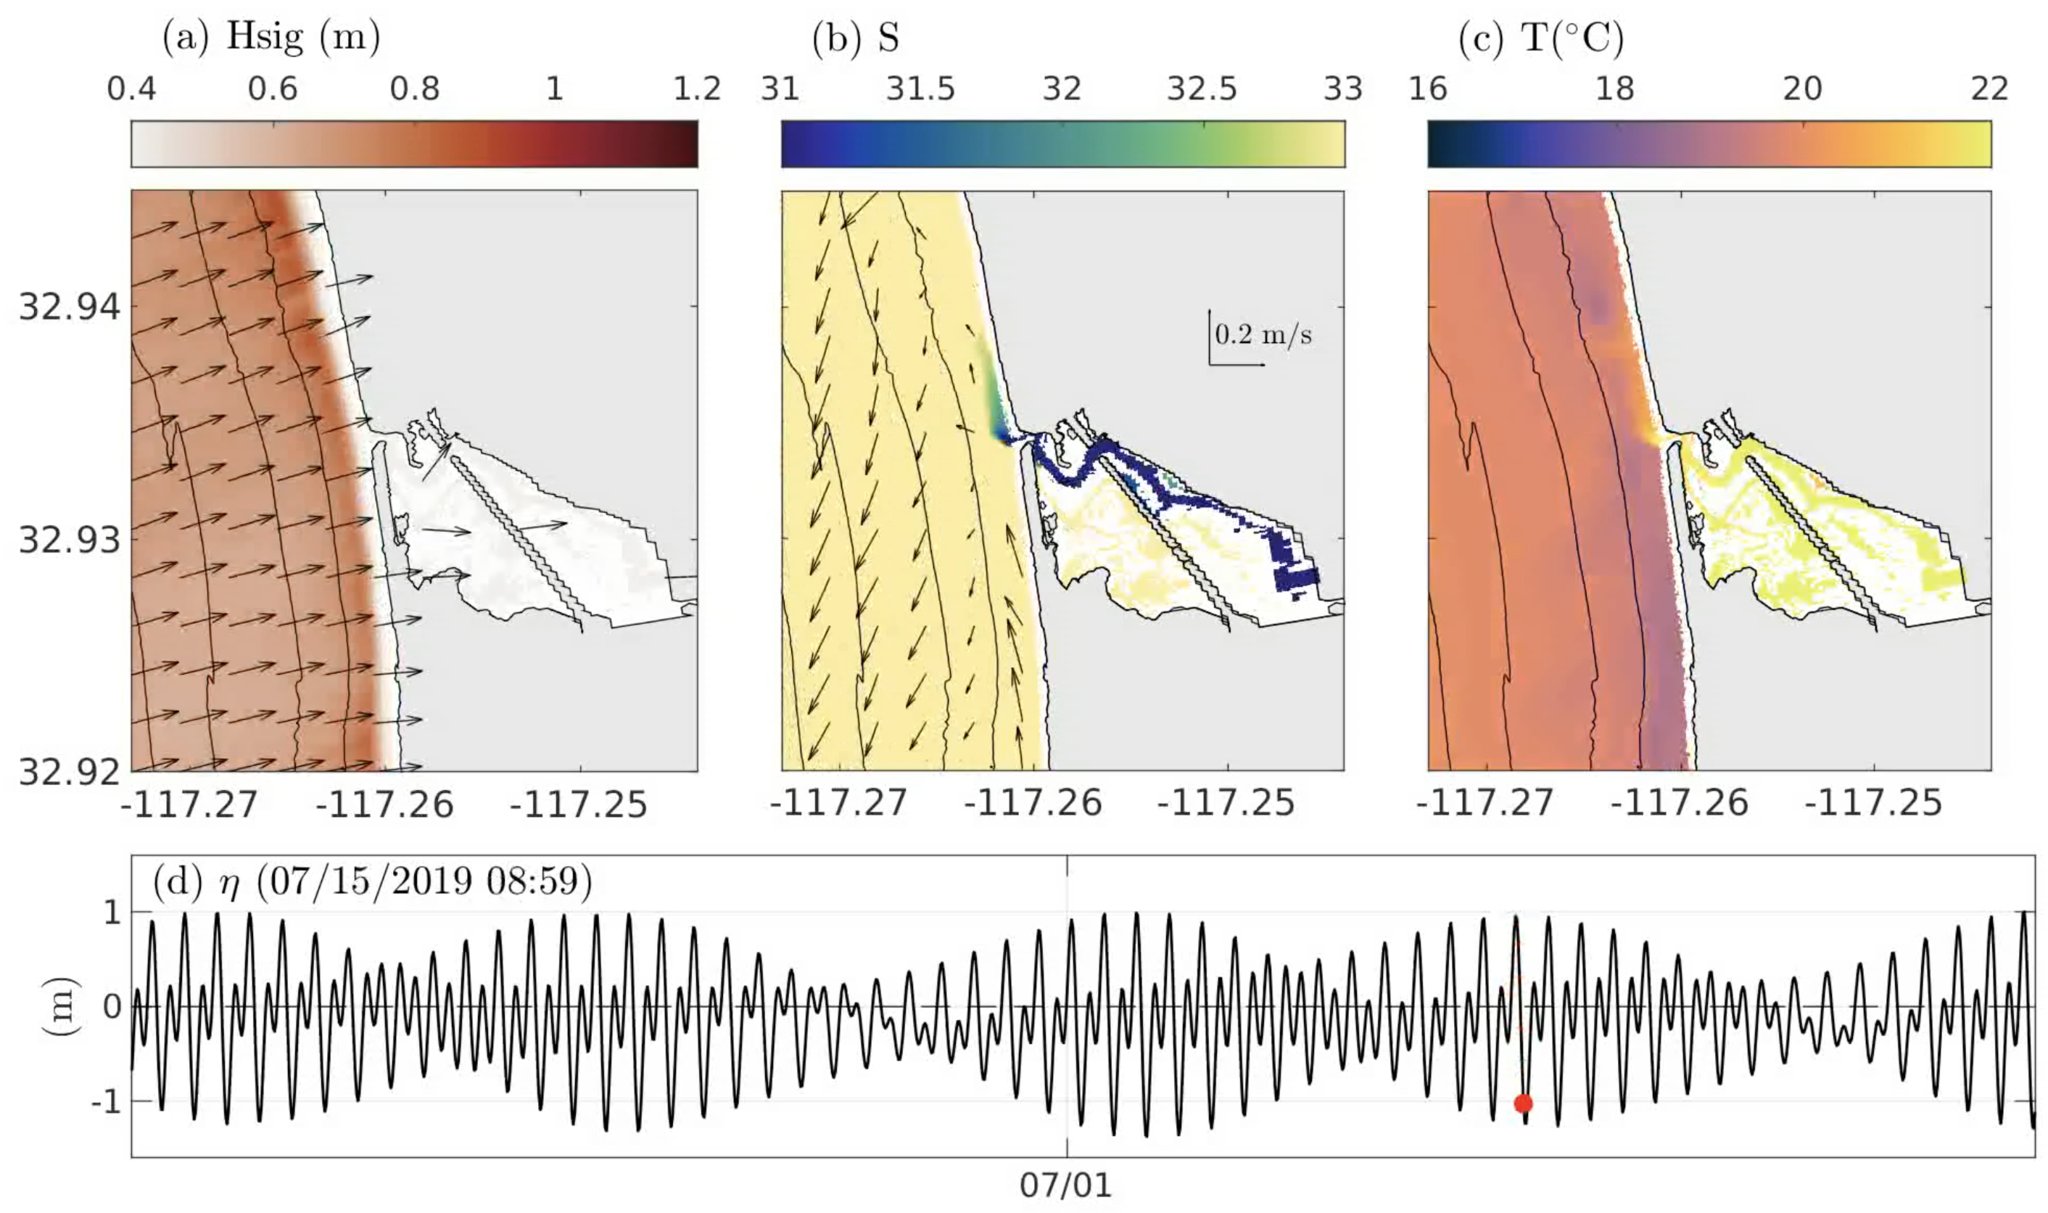
Figure 4. LPL zoom snapshot on 7/15/2019. Zoom in from figure 3 around Los Peñasquitos lagoon of a) significant wave height (color) and direction (arrows), b) surface salinity, c) surface temperature, d) sea surface elevation over the first 2 months of the simulation with the snapshot time marked with a red dot. Note that the waves during this time are coming from a slightly southerly angle driving surfzone currents (and the Los Peñasquitos lagoon river plume) northward.

Figure 5. LV4 LPL movie 5-days mid 2019. a) significant wave height (color) and direction (arrows), b) surface salinity, c) surface temperature, d) surface dye concentration (dye is released with the freshwater sources in each estuary) over the full lv4 domain, and e) sea surface elevation over the first 4 months of the simulation with the snapshot time marked with a red dot. Only 5 days are shown due to file size capacity!